“android提供了一些命令方便我们调试,这里特意整理了相关指令“
UI 分析
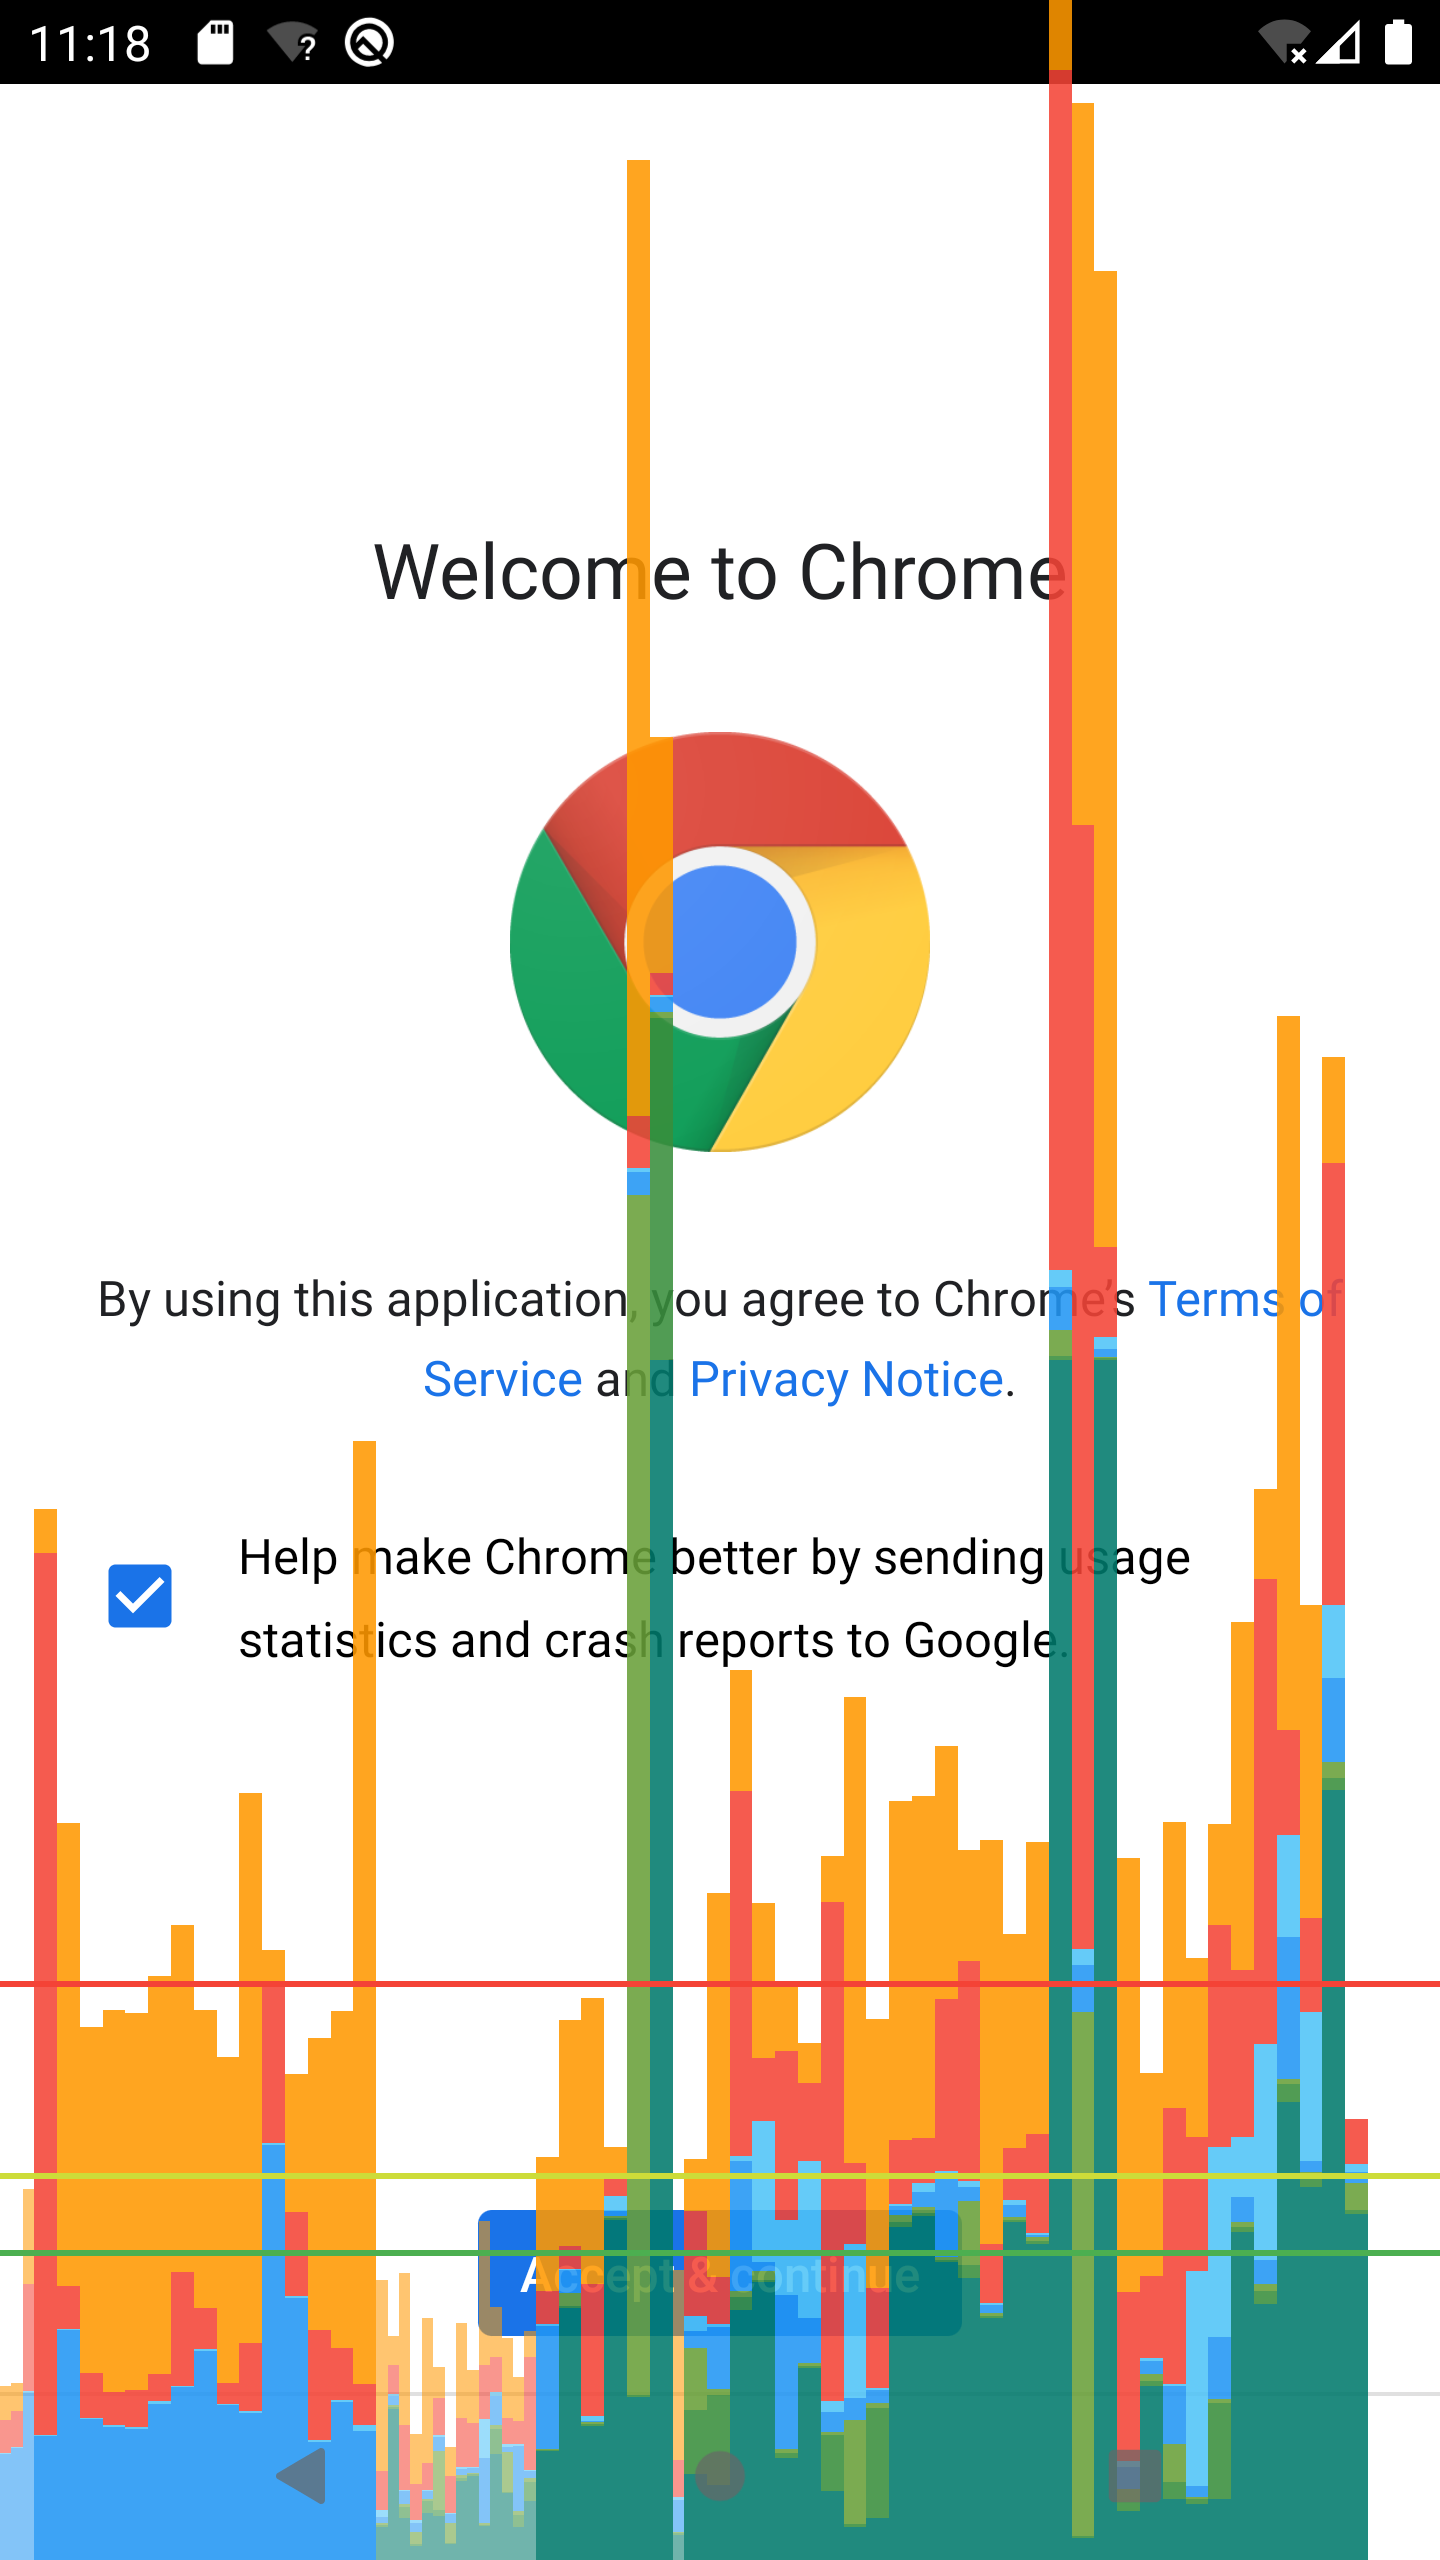
1、开启视图边界
adb shell setprop debug.layout true
然后重新启动应用生效
同理,关闭如下
adb shell setprop debug.layout false
2、打开 Overdraw 检查:
// Controls overdraw debugging.
// Possible values:
// "false", to disable overdraw debugging
// "show", to show overdraw areas on screen
// "count", to display an overdraw counter

adb shell setprop debug.hwui.overdraw show

3、查看dirty区域:
// Turn on to draw dirty regions every other frame.
//
// Possible values:
// "true", to enable dirty regions debugging
// "false", to disable dirty regions debugging

adb shell setprop debug.hwui.show_dirty_regions true

// System property used to enable or disable dirty regions invalidation.
// This property is only queried if {@link #RENDER_DIRTY_REGIONS} is true.
// The default value of this property is assumed to be true.
//
// Possible values:
// "true", to enable partial invalidates
// "false", to disable partial invalidates

adb shell setprop debug.hwui.render_dirty_regions true
kill掉然后重启进程即可
4、显示hardware layer层的更新,对分析LAYER_TYPE_HARDWARE问题十分有效
// Turn on to flash hardware layers when they update.
//
// Possible values:
// "true", to enable hardware layers updates debugging
// "false", to disable hardware layers updates debugging

adb shell setprop debug.hwui.show_layers_updates true
5、打印帧率绘制相关信息
adb shell dumpsys gfxinfo
6、查看GPU 绘制情况
// System property used to enable or disable hardware rendering profiling.
// The default value of this property is assumed to be false.
//
// When profiling is enabled, the adb shell dumpsys gfxinfo command will
// output extra information about the time taken to execute by the last
// frames.
// Possible values:
// "true", to enable profiling
// "visual_bars", to enable profiling and visualize the results on screen
// "false", to disable profiling
// @see #PROFILE_PROPERTY_VISUALIZE_BARS

adb shell setprop debug.hwui.profile #{value}
7、设置GPU 最大帧数
// System property used to specify the number of frames to be used
// when doing hardware rendering profiling.
// The default value of this property is #PROFILE_MAX_FRAMES.
//
// When profiling is enabled, the adb shell dumpsys gfxinfo command will
// output extra information about the time taken to execute by the last
// frames.
//
// Possible values:
// "60", to set the limit of frames to 60

adb shell setprop debug.hwui.profile.maxframes #{value}
8、开启调试非矩形剪辑操作
// Turn on to debug non-rectangular clip operations.
//
// Possible values:
// "hide", to disable this debug mode
// "highlight", highlight drawing commands tested against a non-rectangular clip
// "stencil", renders the clip region on screen when set

adb shell setprop debug.hwui.show_non_rect_clip #{value}
9、开启\关闭硬件加速
开启硬件加速
adb shell setprop debug.hwui.renderer opengl
启用 Skia 渲染
adb shell setprop debug.hwui.renderer skiagl
内存分析
1、dump内存信息分析:
adb shell am dumpheap <进程PID> /data/boutique.hprof
格式转换:sdk/tool/hprof-conv
2、打印内存信息
adb shell procrank|grep ${your_package_name}
adb shell dumpsys meminfo ${your_package_name}  //更详细一些
adb shell cat /proc/meminfo // 查看系统ram,堆内存等信息
adb shell procrank //查看系统所有应用的内存使用情况,或者 /system/xbin/procrank
3、无kill权限, 杀死进程
am force-stop packageName
4、top命令
查看资源占用率前5的应用
adb shell top -m 5
5、获取cup信息
adb shell cat /proc/cpuinfo
6、查看input设备信息
adb shell cat /proc/bus/input/devices
7、查看ip,mac信息
adb shell netcfg
8、获取当前activity信息
adb shell dumpsys window | grep mCurrentFocus
应用耗时分析
1、在代码里面,给应用打trace,获取对应的火焰图
// 设置开始记录方法调用情况·1
// param1:保存文件的路径
// param2: 文件最大容量,单位是byte
Debug.startMethodTracing("/stora·1ge/sda1/debug.trace", 50 << 20);

// 结束记录方法调用情况
Debug.stopMethodTracing();
用Android studio打开debug.trace文件即可
系统事件分析
1、 监听按键事件
adb shell getevent
2、查看系统异常
logcat -s AndroidRuntime
logcat -s ActivityManager,AndroidRuntime,System.err
gradle编译
在项目目录下输入如下,即可在output目录下获取对应的apk包:
$ chmod +x gradlew
$ ./gradlew assembleDebug
$ gradlew processDebugManifest --stacktrace //查看manifest在编译时候的错误(如果有)
后记
调试手段有很多,最适合的才是最好的。
—— Weiwq 后记于 2019.09 广州